We’ve gone beyond the age when projects were just numbers in a spreadsheet.
Over the years, studies have been conducted to better understand how humans work and what processes need to be improved to make us more productive. All results have led us to understand that we are naturally highly visual beings, not mere “mechanical Turks.”
Humans can process complete images in a matter of just 13 milliseconds. This proves that we are, by nature, visual learners. Even more so, this has had tremendous effects on the way we work. Pairing text with images has been proven to help us remember as much as 65% of the information even three days later.
But how does this all tie to project management?
What is visual project management?
Visual project management refers to the approach where you rely on visuals to plan projects, monitor progress, and analyze work.
This is perhaps the most convenient way for managers like you to get a complete overview of your projects, your team’s workload, and your duties.
Beyond just data visualization, visual project management takes work, team, and task management to another level through highly visual apps and methods.
You’re no longer simply staring at a chart, infographic, or timeline. But instead, work with this information, monitor it, and keep a change log of all tweaks—all in real-time and with multiple collaborators coming in to help. Kind of like you would with actionable tables, calendars, and other image-based structures.
We don’t just learn visually. We communicate with the help of symbols and images too. We use intentional hand gestures when our words aren’t enough, add emojis to our conversations when we feel like amplifying our sentences—or just don’t know what to say—and we’ve been creating discussions based on gifs.
That’s just for fun. The truth is, we’ve been using images and symbols a lot to save time or fill in the gaps when missing the right words.
In a nutshell, written information is made actionable through Gantt Charts, Kanban boards, dashboards, and other visual representations in project management.
Visual project management applies to all areas and elements involved in one project. Even at a company level. From projects and teams to individual employees, tasks, reporting, and finances.
Getting started with managing your first projects
With project management, you’re paying extra attention to how your business goals align with the work that goes into a project, the team members and resources needed, and budgets.
Paymo, a work management software for small-to-medium teams, helps you get accurate data on all project matters and keep analytics in sight at all times. All this without having any information distorted.
Start your free Paymo trial to test out its leading features on your own projects.
To start, you’ll need an overall look at everything you’re in charge of. Paymo’s Home module reunites tasks from all projects—for yourself (My Tasks) or the whole team (Team’s Tasks)—so you can keep operations in check and focus only on the most pressing activities.

Home module displaying one user’s tasks in Paymo.
Depending on how you’d like to visualize your tasks, three different task views exist.
List View
Similar to a to-do list, this view gives you a quick look over the most important task details like description, assigned users, status, and priorities so you can take action immediately, with all the necessary guidance.

List view with task details
Table View
It lets you display or hide specific task details as columns for increased visibility. For convenience, these can be further edited inline instead of entering each one to fill in its details.

Table view with details you can edit inline
The Table View is best suited for project managers or team leads who want to see on a visual burndown graph how much time their team has spent against every task from the task budget.
Each task list sums up the total estimated hours and price at the end. If you run retainer clients, rename a task list with the desired month in mind, for example, March 2020.
Kanban board
This is my view of choice since it’s the most visual. It allows you to view activities on a board with columns (phases) and move them through a drag and drop action to another column as they advance through the project.

Kanban board view of team tasks across all projects
The Kanban Method is not just handy for your team, who’s likely to enjoy using it since it saves up so much time. Generally, it’s useful for managers who want to get an overlook at work and spot potential bottlenecks ahead of time.
Kanban tools help them visualize, review, and process any given project status. To see how you can use Kanban boards for your projects, check out our list of hands-on examples.
These visual project management tools are also convenient for reducing the number of back-and-forth emails sent among your team members—as everyone in your workspace can see the project’s progress through its various phases.
Managing projects through visual project management software
If you don’t need to have your hands in all buckets, start by seeing how all projects stack against each other and whether there are any red flags you should pay attention to.
Paymo’s Projects’s Table View gives you a perspective on each project’s overall health in terms of the time spent on it vs. the total hourly budget. Like an individual project’s table view, it renders all project details such as the number of completed tasks, hours booked, or Unbilled AR as columns to be further displayed or hidden.

View of all company projects
“But I have 100 projects.”
Filters allow you to be more granular when the situation asks for it.
Want to see only the projects and their status for a particular client? Just add a filter by the client and select the desired one. Then click on the Export as button to download.
Or use stronger combo filters, such as a client’s projects that your team’s worked on for more than 40 hours.
If you have two or more lengthy projects spanning over the same or similar period, it might be more difficult for you to take on extra work for a small team that’s caught up with other tasks.
The Portfolio Gantt Chart helps to maintain a healthy project pipeline; you may decide whether to take on more projects or stick with the current ones.

Portfolio Gantt Chart
This project view also displays your time spent on each project or client to see who brings in more money theoretically. Based on this information, you can adapt schedules and see where to fit in more work.
A newer feature in Paymo is project profitability in the Finance tab, where you can see your internal costs, billable amount, and margin. If you want to learn how to calculate project profitability with the help of an example, analysis, or use case, there’s a guide for this.
Moving on to the individual project level, the Project Overview indicates the health of your project through multiple widgets. The Time Worked widget tells you how much time has been worked from the total project budget either via a burndown graph or numbers. Meanwhile, the Completed Task widget shows you the number of finished tasks from the total ones, plus any open or overdue tasks.

Visual detailed overview of a project created in Paymo
For a full picture of the project price, analyze the unbilled AR to understand the value of the tasks not yet billed and any expenses attached to the project. You also get a lighter version of the timesheet in which you can toggle between months to see how much time you’ve tracked within this project. Milestones, on the other hand, remind you of upcoming events that must happen to bring the project to reality.
Handling client work
Like looking at your projects and work, you can keep track of client demands and communication through highly visual methods. This type of visual client management system will save you loads of hours on admin work and help you see who your core clients are.
Paymo’s Clients module is tabular too and can be filtered and exported. The Client overview acts more or less like a client dashboard, informing you about the amount of money they owe you, the AR that has not yet been billed, and the time spent on the project.
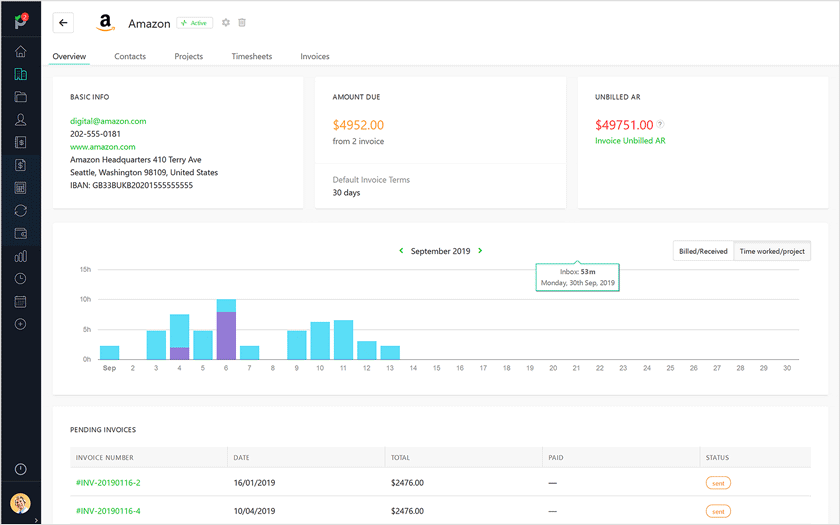
Client overview in Paymo
The Billed vs. Received widget can again be used by managers to conclude if you’re on a path to profitability or if your clients are falling behind their payments. This helps you decide who your top clients are and whether you can continue working with them, or need to charge more for your work.
Managing and working with tasks
Now that you have a clear perspective over your project and clients, it’s time to start the actual work and focus on organizing, prioritizing, and executing tasks at hand.
These visual methods for task management bring flexibility and strategic alignment with your goals, along with ensuring your team works how they feel most comfortable.
As for Paymo’s task views, you’ve got the following options, already mentioned before:
- List view
- Table View
- Kanban board
This time, you can also tap into the individual power of Gantt Charts at a task level. There are three key uses to this view:
- Plan and schedule your projects task by task
- Keep track of task durations and adjust their length accordingly
- Visualize how tasks relate to one another and other upcoming milestones via dependencies

Gantt Chart view of project tasks
Looks complicated?
Creating a Gantt Chart from scratch is not as easy as it sounds unless you’re using a tool designed for this. So we’ve put together a brief but detailed overlook of everything you need to know before starting to use this method.
All task dependencies and constraints aside, some teams are lost without one as they’ll only struggle to maintain clear schedules and deliver work on time.
Team management
What we don’t know yet is who of those assigned users should work for how many hours within the estimate, during the set date range.
That’s where the Team Scheduler comes in. Tasks with assigned users and start and end date automatically show up as ghost bookings on a timeline. These are suggestions on behalf of the system to save you precious time when it comes to scheduling your team. What’s left is to click on them and specify how many hours a user should work from the task estimate within the chosen date range.

Team Scheduler module in Paymo
For visual project management, the Team Scheduling module displays your employee’s availability, including who’s overbooked and who can take in more work.
Project managers can ultimately see whether or not there are any kinds of resource clashes or if they need to readjust them accordingly.
Not all team members have the same outputs and some are unable to handle multiple projects at the same time. Gradually, you’ll be able to develop patterns and a better understanding of how many projects each of your team members can tackle at a time.
Creating a resource plan is a more complex process that requires you to go through 6 main steps. Check out our guide to scheduling your team for all the particularities.
Since this tool works similarly to a visual event planner, you can also use it as a replacement for an HR tool to mark vacations and OOO days on the same timeline with the task bookings. Just choose a date range and leave type for easy recognition. This will also help you avoid bottlenecks by showing you exactly which team members you can rely on during a certain time period.
You can book leave days at a company level as well. For non-working days like a vacation or bank holidays that the entire company needs to take, go to your Company settings → H.R. Settings → Leave days.
Then you’ll be able to add user-level leave days you’ve already set in the Resource Scheduler from the User overview → Leave Planner.
Every tool that falls into the category of visual resource management will give your project and team clarity. Your managers will be able to quickly identify issues, see where they need to re-allocate work, and if there’s any task or person falling behind.
Keeping track of how users spend their time at work
Monitoring time can help you set better time estimates, plan the project schedule accurately, as well as prevent overbooking your teammates.
Above all, if you’re looking for transparency, a visual project management system with time-tracking functionalities is what you need. Such a platform gives your managers strong insights into the team’s progress while also allowing team members to see what their colleagues are working on.
This is not only motivational but also a great help for anyone in the company. Don’t know about you, but I always want to see what my teammates are working on so I’ll be able to prioritize my own work based on when they’ll be able to review it or take care of a subtask that’s related to one of my duties.
In Paymo, you can add time entries in bulk or using the in-app web timer:
![]()
Time tracker opened in Paymo
If you’d rather work outside of your web browser, you can use the desktop widget to add time in bulk or intervals, get a visual burndown graph of your time entries, and record even idle time that you can later discard. No idle time detection with this widget. If you’re on the go, opt for the mobile apps available (Android and iOS).
Time logs are directly recorded inside the Timesheets module. Using simple timesheet software makes it easy to increase work transparency as it allows everyone to work equal hours at a team level. Use them to see just how many hours your team members spent on a task during a particular period:

Timesheet example
The timesheets offer 4 distinct views of your recorded time: Day, Week, Month, and Agenda for a display of your time entries in a table format.
TIME TRACKING FACT
Managing a remote team and need to see what they’re doing in real-time? Active timers can also be used to display who’s currently working on a specific task whenever they start their timer.
Use these timesheet entries to build customizable time reports. The main benefits to using time reports are:
- Internally – See what your team is working on or measure performance to see whether your team is hitting their estimates or not.
- Externally – Get paid accurately by your clients and provide a detailed work trail of your efforts.
Static Reports can be used to share insights on a set timespan, while Live Reports update themselves automatically as you work on the project. No need for you to send in updates to your clients every single hour as they can check them themselves to find out about the latest changes.
Apart from the text format, Paymo’s time reports are also exportable as a pie chart and bar chart. One caveat: they display information based on the first parameter chosen under the Display & Group by area (inside the time report settings), where you select what to show up on the time report and in which order.

Time report for work on multiple projects
This pie chart, for instance, shows you all tracked time across all projects, so you know which one takes up your most efforts:

Pie chart showing time tracked across different projects
Of course, there’s also a User overview for your employees where you’ll clearly see what’s expected of them through the total workday length as well as when the week starts. The overview can help you assess your team’s performance, calculate their wages, and open the door for conversations about promotions and turnaround time.

User activity overview
Booked legal leave days display the paid leaves in a burndown chart. Your non-paid leave days don’t count towards it but get registered in the Unpaid leave area. The monthly performance widget shows you how much time a team member has tracked from the hourly budgets of the tasks they’ve been assigned to so you can assess their performance. This widget allows you to go 3 months in the past, so for more accurate analytics, go back to the time reports to see how a user’s activity evolved in time.
Visual project management for financial aspects
Yes, all these visual dashboards can save you a lot of time (benefit) from spending countless hours piecing together incomplete analytics.
The company’s Dashboard holds a key priority in your workflow from a financial perspective to see if your company is growing or having a bad streak of ill-paying clients.
Ready to present your stats? Enlarge the Finance widget, then use the toggler to zoom into the time frame you’re interested in. This same widget will show you how many invoices were paid so you can make sure no payments are left behind.

Finance widget displaying information regarding the status of your invoices
The Dashboard also acts as a health barometer for your whole business. Other widgets will help you extract vital information like late and due milestones or billable vs non-billable time to see if you spend more time on admin duties than on actual work. If the balance tilts towards non-billable time on internal projects, you’ll need to focus on customer acquisition for a while. You’ll also get the unpaid balance data to see who hasn’t paid you yet. It’s really a good replacement for a financial analyst in small teams.
Are you still sending those plain invoices?
Stop right now and opt for customizable invoices, which you can tailor to your own brand through the WYSIWYG editor or more advanced HTML/CSS editor to stand out from the competition.
Same for estimates. These can then be compared to your invoices to see if everything’s in check. For both invoices and estimates, the table format view will show you the status of each one (draft, sent, invoiced, paid, etc.).

Invoices displayed with their status
This way, you don’t have to email your client repeatedly to ask if they got or paid an invoice.
These visual cues help you measure and maintain your business’ financial health as you can see how many invoices/estimates have been sent and viewed. In return, you’ll have leverage when it comes to negotiating payment or speeding up the collection process.
As for expenses, you can add a tag to each (lunch, travel, client meeting, etc.) for further clarification and to visualize which have been billed or not.
Tip: Always take clear pictures of your receipts to attach them to an expense, so you never have to wonder where you’ve placed these when your accountant asks for them.
Where to take your visual project management efforts next?
If I’ve managed to help you understand the benefit of visual project management methods, choose one of these cloud-based project management tools from this list that has a reporting feature, modern look, and is best suited for your new workflow and to bring your team on board. There are three main areas of interest to keep in sight:
- How work on projects and tasks develops in time
- What your team is working on and how much time they’re putting into each activity
- Maintaining a healthy client relationship when it comes to communicating the project’s status and financial matters
Feel free to share the article with someone who’s had it with boring tables and spreadsheets and has to see the power of visual project management. If you need more info on a better approach and methodology for the project you’re working on, read this comparison of different project management methodologies for swifter execution.
Images are already proven to make our lives and work easier, so how will you change your project management workflows to make them more visual?

Alexandra Cote
Author
Alexandra Cote is a SaaS content writer and strategist with a passion for workplace productivity, social media marketing wonders, conversion rate optimization, artificial intelligence, and keyword research. Reach out to her via LinkedIn.